Matlab plot syntax is easy to use but apparently easy to forget.
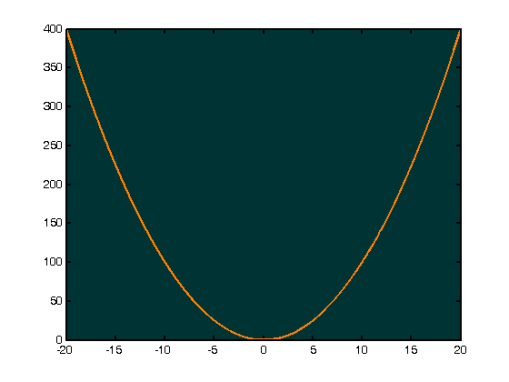
Here I’m plotting the line y = x2 from x = -20 to +20.
% generate x, y vectors
x = -20:0.01:20;   % x goes from -20 to 20 in steps of 0.01
y = x.^2;            % generate y
plot(x,y);

Hmm the plot would be easier to see if it had grid lines drawn in.
% generate x, y vectors
x = -20:0.01:20;   % x goes from -20 to 20 in steps of 0.01
y = x.^2;            % generate y
plot(x,y);
grid on;
Hmm, I want to zoom the plot in so it shows from -2 to +2 of the x-axis and from -1 to +3 of the y-axis.
% generate x, y vectors
x = -20:0.01:20;   % x goes from -20 to 20 in steps of 0.01
y = x.^2;            % generate y
plot(x,y);
grid on;
axis( [-2, 2, -1, 3] );  % NOTICE this goes AFTER the plot() command
% axis( [ xmin, xmax, ymin, ymax ] ) ;
% you must have the [], the axis function takes ONE argument with vector type, not 4 different arguments.
Finer control
We can get much finer control over our matlab plots by ACQUIRING THE HANDLE to the axes.
The axes exist as an object in memory somewhere inside the MATLAB “machine”. The ‘handle’ to the axes is YOUR POINTER that you can use to make changes to that axes object, even though the MATLAB program isn’t fully under your control. You have control over PARTS of MATLAB THROUGH these handles you can get.
This is easy.
So howdya get the handle?
% generate x, y vectors
x = -20:0.01:20;   % x goes from -20 to 20 in steps of 0.01
y = x.^2;            % generate y
plot(x,y);

HANDLE = gca;  % "get current axis handle" . . gives you "handle" to the axes that belong to the plot you JUST made.
% Remember, a HANDLE to the axes are just a programmatic "means to control" the axes.

% now try this
get( HANDLE );

%% wow!  you'll see a huge listing here like
%	ActivePositionProperty = outerposition
%	ALim = [0 1]
%	ALimMode = auto
%	AmbientLightColor = [1 1 1]
%	Box = on

% You can customize any of these by choosing something, then SETTING the property using the SET function.

% e.g. let's change the background color to dark blue, and the axes color to
set( HANDLE, 'Color', [0,0.1,0.2] ); %background color to dark blue
How do you change the color of the matlab plot itself?
% generate x, y vectors
x = -20:0.01:20;   % x goes from -20 to 20 in steps of 0.01
y = x.^2;            % generate y
plothandle = plot(x,y);

% now try this
get( plothandle ) ;
%lists all properties you can change of the PLOT itself

set( plothandle, 'Color', [ 1, 0.5, 0 ] );  % plot color to orange
set ( plothandle, 'LineWidth', 1.5 );   % make matlab plot line wider
All the stuff in this section uses code like:
set( HANDLE, 'PropertyName', PropertyValue ) ;
Note that if you use gca, you will be modifying THE WHOLE PLOT. If you use the plothandle = plot(x,y), then you will be modifying ONLY THAT LAST PLOT WHICH YOU CREATED.
So, to do things like MODIFY THE AXIS LABELS, you’d do something like this:
x = 0:0.01:2*pi ;
y = sin( x ) ;
hold off ; % REPLACE last plot with the new one I'm
% about to draw (if any already existed onscreen)

h = plot( x, y ) ; % SAVE THE HANDLE so we can
% modify the plot lines
set( h, 'Color', [1,0,0] ) ; % change color of the
% sin(x) plot to (100% red, 0% green, 0% blue)
set( h, 'LineWidth', 1.5 ) ;
hold on ;  % keep the last plot on while we
% put a new plot
y = cos( x ) ;
h = plot( x, y ) ; %SAVE THE HANDLE to the cos(x) plot
% so we can change its color below

set( h, 'Color', [0,0,1] ) ;%cos(x) plot (0% r, 0% g, 100% b )
set( h, 'LineWidth', 1.5 ) ;%widen pen width
axis( [ 0, 2*pi, -2, 2 ] ) ;% ZOOM TO
% [ xmin, xmax, ymin, ymax ]

set( gca, 'XTick', 0: pi/2 : 2*pi ); % make the ticks on
% the x-axis get labelled:
% FROM (START_VAL : IN_STEPS : TO_END_VALUE)
% so from 0 TO 2*pi IN STEPS OF (pi/2).

set( gca, 'XTickLabel', { 'ZEER', 'pi/2', 'pi', '3PI/2', '2*pi' } ) ; %
% labels are 'ZEER', then pi/2, then pi, then 3*pi/2..
% notice these are simply TEXT labels, they are not computed
% or interpretted in any way (they are blindly pasted onto
% the plot axis) so, if you don't supply enough labels
% then MATLAB will wrap back to your first label, like an IDIOT!!
%

set( gca, 'Color', [0.25,0.9,0.7] ) ; % change color of
% the entire axis i.e the background-color

3 Comments
this web page is much better than help desk of mathworks.
Agree to the above comment strongly!
Thank you!